llm-d
32 commits/week averaged over the trailing window (niche median 32). No paper is linked in OpenAlex. Dependents: no reading in the scored panel. 4,661 GitHub stars, recorded, not scored. Measured for llm-d as of 2026-09-26; sources: GitHub, OpenAlex and deps.dev where linked.
Is llm-d still maintained?
Development velocity is the one measurable axis of three: 32 commits per week averaged over the trailing window (niche median 32/wk, n = 13).
GitHub averaged 32 per week over the trailing window; raw weekly counts below are individual weeks.
Last commit week 2026-09-20.
Commits in the latest captured week vs 4 weeks earlier: 31 · vs 26 weeks earlier: 22 · 52-week range: 0 to 101 commits in an individual week.
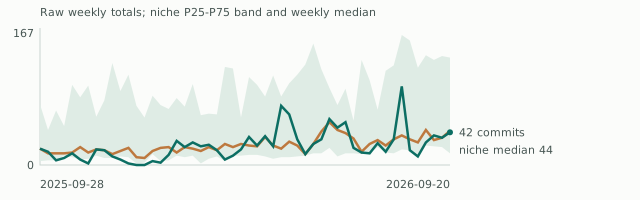
| Week starting | Commits | Niche P25 | Niche P75 |
|---|---|---|---|
| 2026-08-02 | 33 | 15 | 128 |
| 2026-08-09 | 101 | 20 | 167 |
| 2026-08-16 | 19 | 19 | 160 |
| 2026-08-23 | 11 | 11 | 125 |
| 2026-08-30 | 29 | 25 | 141 |
| 2026-09-06 | 38 | 24 | 135 |
| 2026-09-13 | 35 | 23 | 140 |
| 2026-09-20 | 42 | 15 | 138 |
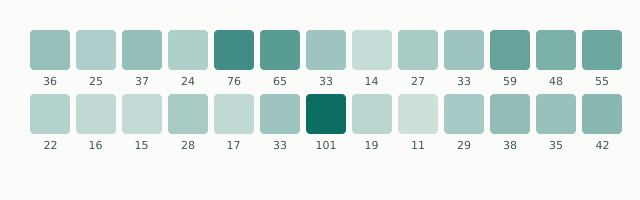
All 52 weeks
| Week starting | Commits |
|---|---|
| 2025-09-28 | 21 |
| 2025-10-05 | 17 |
| 2025-10-12 | 6 |
| 2025-10-19 | 9 |
| 2025-10-26 | 15 |
| 2025-11-02 | 7 |
| 2025-11-09 | 2 |
| 2025-11-16 | 20 |
| 2025-11-23 | 19 |
| 2025-11-30 | 11 |
| 2025-12-07 | 7 |
| 2025-12-14 | 2 |
| 2025-12-21 | 0 |
| 2025-12-28 | 0 |
| 2026-01-04 | 5 |
| 2026-01-11 | 3 |
| 2026-01-18 | 13 |
| 2026-01-25 | 31 |
| 2026-02-01 | 23 |
| 2026-02-08 | 29 |
| 2026-02-15 | 24 |
| 2026-02-22 | 26 |
| 2026-03-01 | 19 |
| 2026-03-08 | 7 |
| 2026-03-15 | 12 |
| 2026-03-22 | 20 |
| 2026-03-29 | 36 |
| 2026-04-05 | 25 |
| 2026-04-12 | 37 |
| 2026-04-19 | 24 |
| 2026-04-26 | 76 |
| 2026-05-03 | 65 |
| 2026-05-10 | 33 |
| 2026-05-17 | 14 |
| 2026-05-24 | 27 |
| 2026-05-31 | 33 |
| 2026-06-07 | 59 |
| 2026-06-14 | 48 |
| 2026-06-21 | 55 |
| 2026-06-28 | 22 |
| 2026-07-05 | 16 |
| 2026-07-12 | 15 |
| 2026-07-19 | 28 |
| 2026-07-26 | 17 |
| 2026-08-02 | 33 |
| 2026-08-09 | 101 |
| 2026-08-16 | 19 |
| 2026-08-23 | 11 |
| 2026-08-30 | 29 |
| 2026-09-06 | 38 |
| 2026-09-13 | 35 |
| 2026-09-20 | 42 |
GitHub commit_activity · period 2025-09-28 to 2026-09-20 · n = 52 weeks · method weekly totals; reconstructed dates · updated · version 9d2fe956adbc-b1 · CSV
Readings
| Reading | Value | Δ 4 weeks | Δ 26 weeks | 52-week range | Instrument | Date | Reproduce | Previous reading |
|---|---|---|---|---|---|---|---|---|
| Commits per week | 32 | -3.3 | 14.3 | 7.4 to 41.3 | GitHub, trailing 12 weeks | 2026-09-26 | Public query | 30.3 |
| Citing works | no reading | no reading | no reading | no reading | OpenAlex, all years | 2026-09-26 | Public query | no reading |
| Direct dependents | no reading | no reading | no reading | no reading | Direct dependents | 2026-09-26 | Public query | no reading |
| Daily dependents (unscored) | no reading | no reading | no reading | no reading | deps.dev REST, unscored | 2026-09-26 | Public query | no reading |
| Stars | 4,661 | 347 | no reading | 3,674 to 4,661 | GitHub stars, unscored | 2026-09-26 | Public query | 4,593 |
Evidaxis snapshot · period 2026-09-26 · n = 1 system · method source linked readings · updated · version 9d2fe956adbc-b1
How to cite llm-d's record?
Evidaxis. llm-d measurement record. Snapshot 2026-09-26. urn:evidaxis:claim:e_KR3M8ESKAEW:m3:2026-09-26. CC0-1.0. https://evidaxis.org/e/e_KR3M8ESKAEW/
Evidaxis · period 2026-09-26 · n = 1 system · method claim URN · updated · version 9d2fe956adbc-b1
How does llm-d compare with its niche?
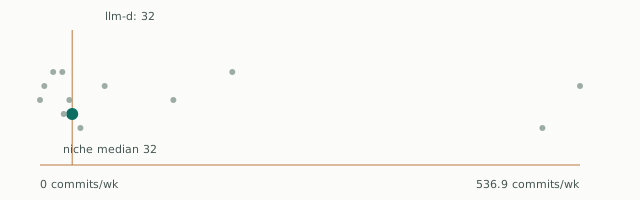
13 systems in Inference & Serving; niche median 32 commits per week. The reader chooses the sort order.
| AIBrix | 22.2 | no reading | no reading | 5,113 |
|---|---|---|---|---|
| KTransformers | 4.3 | 9 | 1 | 19,537 |
| llama.cpp | 132.6 | no reading | 68 | 129,606 |
| llm-d | 32 | no reading | no reading | 4,661 |
| LMCache | 40.2 | 2 | 3 | 11,912 |
| LMDeploy | 13.1 | no reading | no reading | 8,099 |
| Mooncake | 64.3 | 13 | 0 | 6,664 |
| Nano-vLLM | 0 | no reading | no reading | 15,631 |
| Ollama | 23.6 | no reading | 1,078 | 181,771 |
| SGLang | 499.5 | 102 | 13 | 36,455 |
| TensorRT-LLM | 191.2 | no reading | 0 | 14,719 |
| vLLM | 536.9 | 1,587 | 150 | 92,723 |
| Xinference | 29.2 | no reading | no reading | 9,592 |
Evidaxis snapshot · period 2026-09-26 · n = 13 systems · method medians of measured values · updated · version 9d2fe956adbc-b1 · CSV for this niche
What changed since the last snapshot?
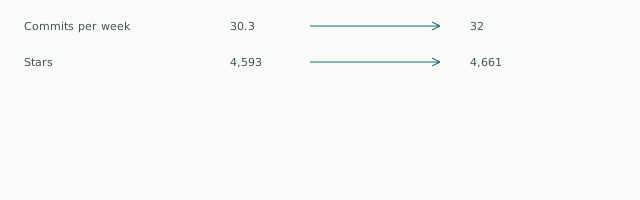
2 published readings changed between snapshots fcfd3a7ccdcb and 9d2fe956adbc.
| Metric | Previous | Current | Delta |
|---|---|---|---|
| Commits per week | 30.3 | 32 | 1.7 |
| Citing works | no reading | no reading | no reading |
| Direct dependents | no reading | no reading | no reading |
| Stars | 4,593 | 4,661 | 68 |
Evidaxis snapshots · period 2026-09-19 to 2026-09-26 · n = 15 partitions · method paired snapshot values · updated · version 9d2fe956adbc-b1 · History CSV
Take the data or follow changes
Values and captured history are available under CC0-1.0. The system feed records changes to published numbers.
Evidaxis · period 2026-09-26 · n = 1 system · method CC0-1.0 open export · updated · version 9d2fe956adbc-b1
For teams tracking many systems
Use the cohort CSV, snapshot archive and membership manifest to reproduce observations across systems.
Paper and links
Source records identify the system, repository and linked works; no paper authors are published.
What is not measured for llm-d, and why
Missing readings describe instrument coverage. A missing value is not a measured zero.
| Reading | Reason |
|---|---|
| Citing works | not linked |
| Direct dependents | outside panel |
| Daily dependents (unscored) | no reading captured |
Dependents: package outside the frozen m3 panel (2026-07-21), a coverage state, not a measured zero. Unscored daily count: no reading (2026-09-26).
Gate ETA: never published; Evidaxis makes no public actionable prediction.
Dependents ecosystem composition: no reading; this field is not present in the snapshot.
Evidaxis · period 2026-09-26 · n = 1 system · method measurement coverage · updated · version 9d2fe956adbc-b1
Measurement detail
Gate, gauges, percentile, derived signals and snapshot receipt
History: 13 weekly observations; minimum 4. Axis coverage: 1 of 3 axes measurable. Gate: not computable - 1 of 3 axes measurable
Gate: not computable - 1 of 3 axes measurable
llm-d
org- gate
- 0 of 3 axes
Gate: not computable - 1 of 3 axes measurable
· Evidaxis snapshot · 2026-09-26- percentile
- p17
- velocity z
- -1.08 σ
- slope
- -0.009/wk
- weeks
- 26
- peak/wk
- 101
- active
- 26
- total
- 938
- swing
- +1.03×
- regime
- steady
- windows
- 13w vs 39w
- sharpe
- +0.042
- 95% ci
- +0.008, +0.077
- dof
- 50
- date
- week
- 4 of 52
- Δslope
- +8.221/wk
reserved: citation series too short / axis absent for cross-correlation
- status
- reserved
- value
- insufficient data
reserved: cohort N too small for regression (power ~0)
- status
- reserved
- value
- insufficient data
- commit weeks
- 52
- citation years
- 0
- shipped
- 3
- reserved
- 3
shipped
- recency-swing
- commit-sharpe
- commit-changepoint
reserved
- code-leads-citation-lag
- axis-alpha
- gate-eta
Direct-dependents momentum (deps.dev)
Direct-dependents axis: outside the frozen panel; not measured.
- Coverage state
- out_of_panel
- Cohort z
- no axis
- OLS slope
- no reading
- Theil-Sen slope
- no reading
- Latest direct dependents
- no reading
- Confirmed-clean points
- no reading
- Reconstructed history points
- no reading
- As-of partition
- no reading
- Fragility veto
- no reading
- Rising vote
- no
Source: deps.dev (Google), CC-BY 4.0. Modified: aggregated to system-level counts and momentum scores.
Reconstructed history
Reconstructed from git history, not a point-in-time capture. This series is separate from captured observations.
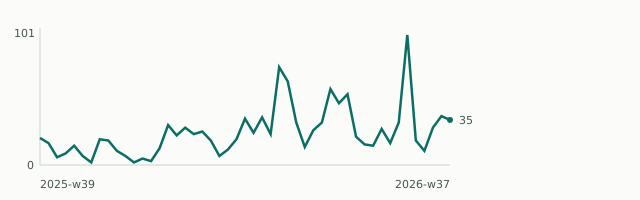
| Period | Commits |
|---|---|
| 2025-w39 | 21 |
| 2025-w40 | 17 |
| 2025-w41 | 6 |
| 2025-w42 | 9 |
| 2025-w43 | 15 |
| 2025-w44 | 7 |
| 2025-w45 | 2 |
| 2025-w46 | 20 |
| 2025-w47 | 19 |
| 2025-w48 | 11 |
| 2025-w49 | 7 |
| 2025-w50 | 2 |
| 2026-w01 | 5 |
| 2026-w02 | 3 |
| 2026-w03 | 13 |
| 2026-w04 | 31 |
| 2026-w05 | 23 |
| 2026-w06 | 29 |
| 2026-w07 | 24 |
| 2026-w08 | 26 |
| 2026-w09 | 19 |
| 2026-w10 | 7 |
| 2026-w11 | 12 |
| 2026-w12 | 20 |
| 2026-w13 | 36 |
| 2026-w14 | 25 |
| 2026-w15 | 37 |
| 2026-w16 | 24 |
| 2026-w17 | 76 |
| 2026-w18 | 65 |
| 2026-w19 | 33 |
| 2026-w20 | 14 |
| 2026-w21 | 27 |
| 2026-w22 | 33 |
| 2026-w23 | 59 |
| 2026-w24 | 48 |
| 2026-w25 | 55 |
| 2026-w26 | 22 |
| 2026-w27 | 16 |
| 2026-w28 | 15 |
| 2026-w29 | 28 |
| 2026-w30 | 17 |
| 2026-w31 | 33 |
| 2026-w32 | 101 |
| 2026-w33 | 19 |
| 2026-w34 | 11 |
| 2026-w35 | 29 |
| 2026-w36 | 38 |
| 2026-w37 | 35 |
| System | Momentum | Percentile |
|---|---|---|
| AIBrix | 58.8 | 83 |
| KTransformers | 30.7 | 8 |
| llama.cpp | 50.3 | 67 |
| llm-d | 36.5 | 17 |
| LMCache | 50.1 | 58 |
| LMDeploy | 50 | 50 |
| Mooncake | 69.9 | 100 |
| Nano-vLLM | 24.5 | 0 |
| Ollama | 49.5 | 42 |
| SGLang | 49.1 | 33 |
| TensorRT-LLM | 56 | 75 |
| vLLM | 37.7 | 25 |
| Xinference | 61.5 | 92 |
Evidaxis · period 2026-09-26 · n = 1 system · method measurement detail · updated · version 9d2fe956adbc-b1 · record JSON · snapshot receipt